
Who I Am
I am a data analyst and research enthusiast passionate about transforming raw data into clear, actionable insights. With experience as a research assistant and a healthcare data analyst, I bring a strong analytical mindset, attention to detail, and storytelling flair to every project. Whether working solo or with a team, I love uncovering patterns, solving problems, and helping people, businesses, and organizations make informed decisions with data.
My core skills include:
Data Entry
Data Cleaning
Data Analysis
Data Visualization & Storytelling
Research
Statistical Analysis
Tools & Soft Skills
Tools
Microsoft Power BI
Canva
Microsoft Excel
Microsoft SQL Server
Microsoft PowerPoint
SPSS
Soft Skills
Report Writing
Attention to detail
Team Collaboration
Problem Solving
Excellent Communication
Critical Thinking
Certifications


Featured Projects
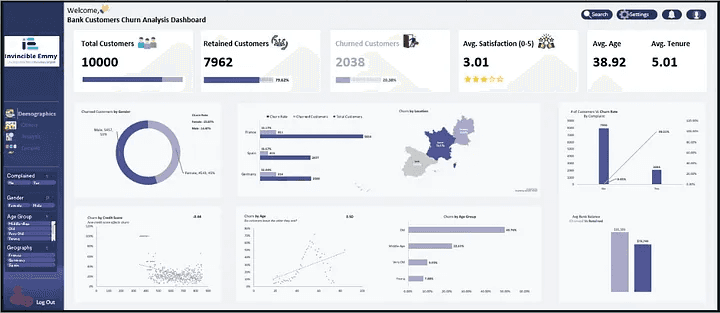
Bank Churn Analysis
This project focused on analyzing business data to answer a key strategic question about why bank customers leave and to uncover actionable insights. Using Microsoft Excel, I analyzed the data using pivot tables and DAX measures, and designed an interactive dashboard, typically developed in tools like Power BI or Tableau, to visualize trends, track performance, and support data-driven decision-making.
Titanic Survival Analysis
I cleaned, analyzed, and built a storytelling dashboard on Titanic dataset to uncover survival trends, communicate insights, and drive recommendations.

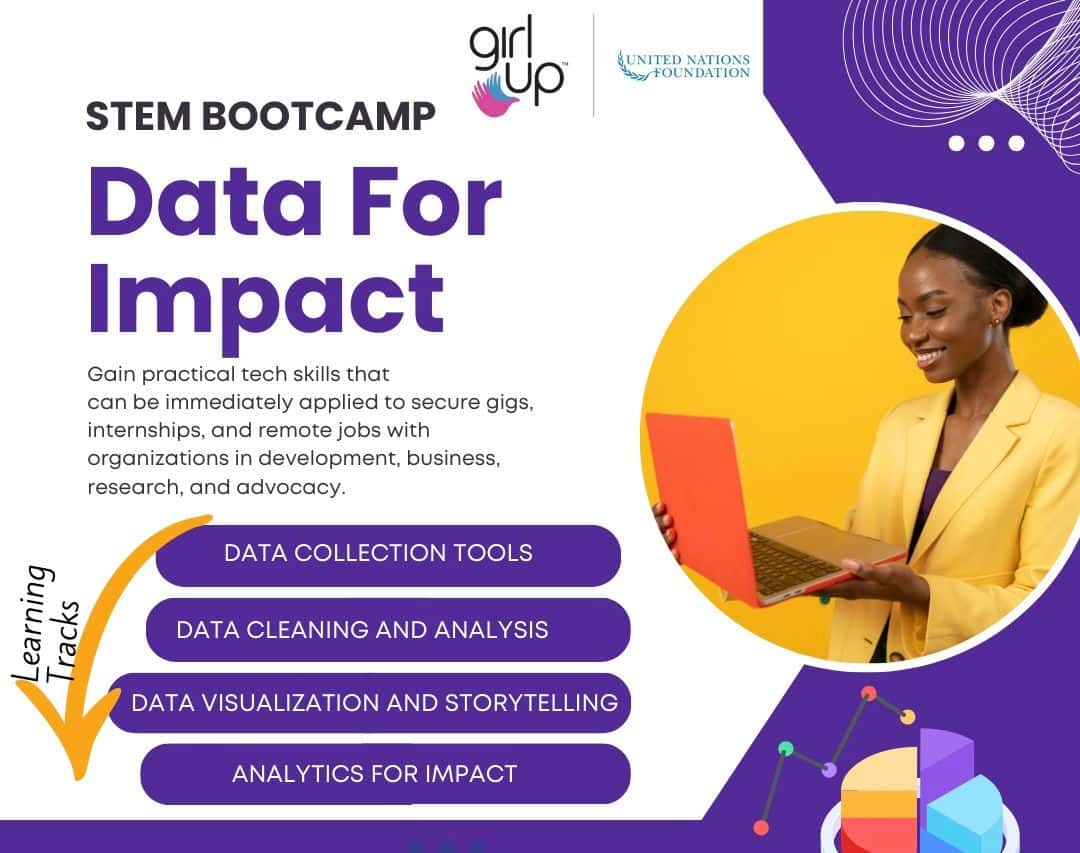
Co-mentor, Data for Impact Bootcamp
I delivered an engaging session on Data Cleaning and Analysis using Pivot Tables, ensuring full comprehension and hands-on practice among participants.
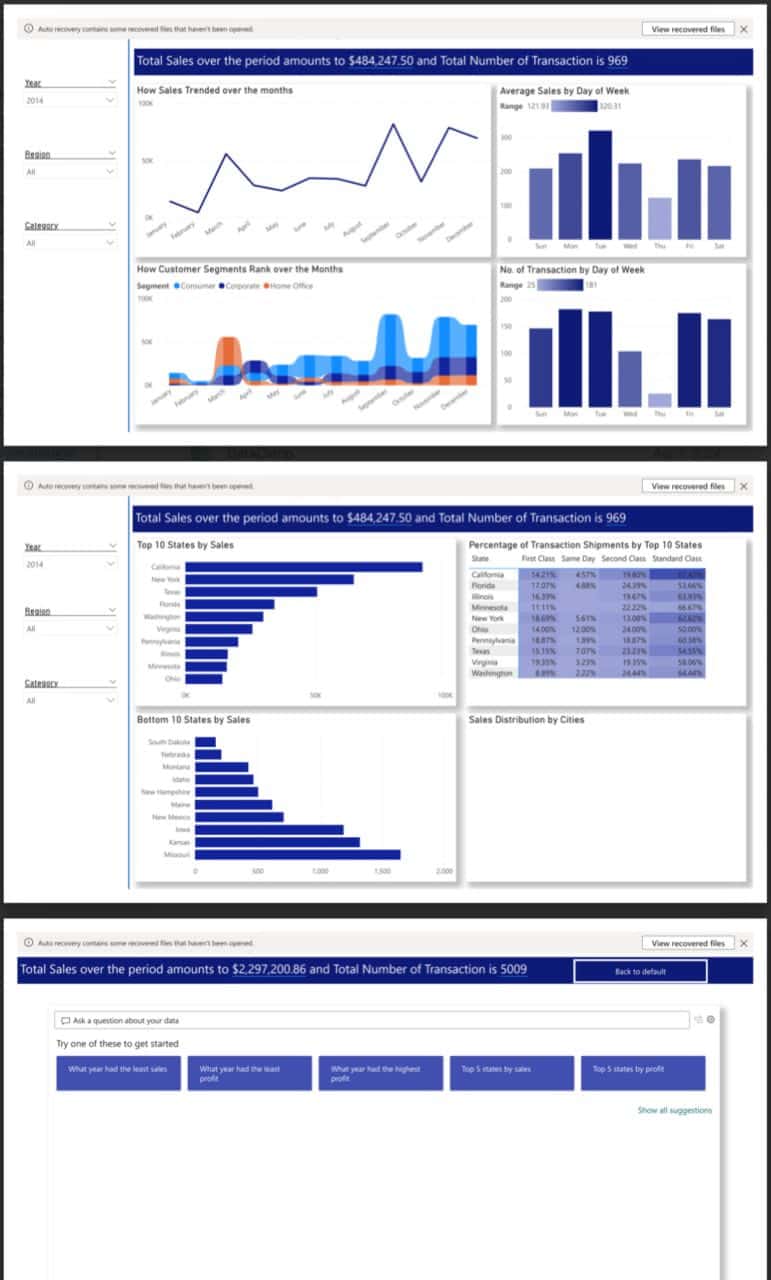
Superstore Sales Power BI Report
I built an interactive dashboard to analyze Superstore sales performance using Power Query and Power BI.
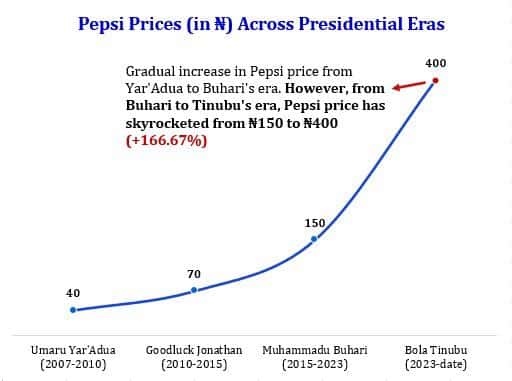
Pepsi Prices Across Presidential Eras
I came across a graphic comparing Pepsi prices during different presidential administrations. Inspired by it, I decided to create my own visualization to tell a clear, data-driven story.
Testimonials
Swipe to see what some of my clients are syaing
Contact Me
Fill out the form below and I will get back to you as soon as possible.
© 2025 BeejayCodes. All rights reserved